![[NAAPO Logo]](../../Images/NAAPOsm.jpg) North American AstroPhysical Observatory (NAAPO)
|
|
SETI and the Spectral Classification of Stars
By: J.D.R. Bahng
It is generally agreed that the most reasonable SETI* (*SETI: Search for Extra-Terrestrial Intelligence.) strategy available today involves the detection and
identification of intelligent signals in the microwave region of the electromagnetic spectrum — the so-called water hole.** (**See COSMIC SEARCH, Serial no. 1, Jan. 1979, page 35.) To do this we need at least one large radio telescope equipped with a very sensitive detector and a smart computer analyzer. In two NASA-sponsored summer projects (Project Cyclops in 1971 and Project Oasis in 1979) studies were made to define parameters of these systems.
The results show that we now have means and capabilities to start a serious SETI program.
There is a possibility that in the near future we may have at our disposal a very sophisticated optical system in space capable of registering the actual images of planets around distant stars.
In either case, the matter of economy and efficiency dictates that the search list be limited to the most likely stars — the "good" stars. There are some 200 billion stars in our Galaxy. Even if we confine ourselves to a space within 1000 light-years from the Sun, a more likely range limit for our technology within a foreseeable future, there are 10 million stars. It is estimated that only about 20 percent of all stars are likely to have planets.*** (***See COSMIC SEARCH, Serial no. 1, Jan. 1979, page 34.) Thus, we must take a census and select some 2 million out of these 10 million stars. Our concern then is; what are the most important characteristics common to good stars?
Of all the stars in the Universe, we know of one that is definitely a good star: our Sun. It is "good" because it has a planet, the Earth, which has life. Because of its proximity we know quite a bit about the Sun. Among other things, we know its mass, diameter, luminosity, and surface temperature. If we find a remote star whose properties are identical or very similar to our Sun, we can be quite certain that it would be a good star. For most stars, however, it is not possible to determine all these characteristics directly. Even the indirect determination is difficult and time consuming in most instances.
Fortunately for us, it is not necessary to determine all there is to know about each star. It is true that every star is different from any other star in some respect, but there are sufficient similarities amongst stars that millions and billions of stars can be classified into a very small number of classes or types by rather a limited set of parameters. The most useful and one of the easiest to obtain is the spectral type.* (*When the light of a star is passed through a prism it may be spread into a spectrum or rainbow of colors, each color representing a different wavelength. From such stellar spectra stars can be classified. — Ed.)
How Astronomers Classify Stars and What This Means to SETI
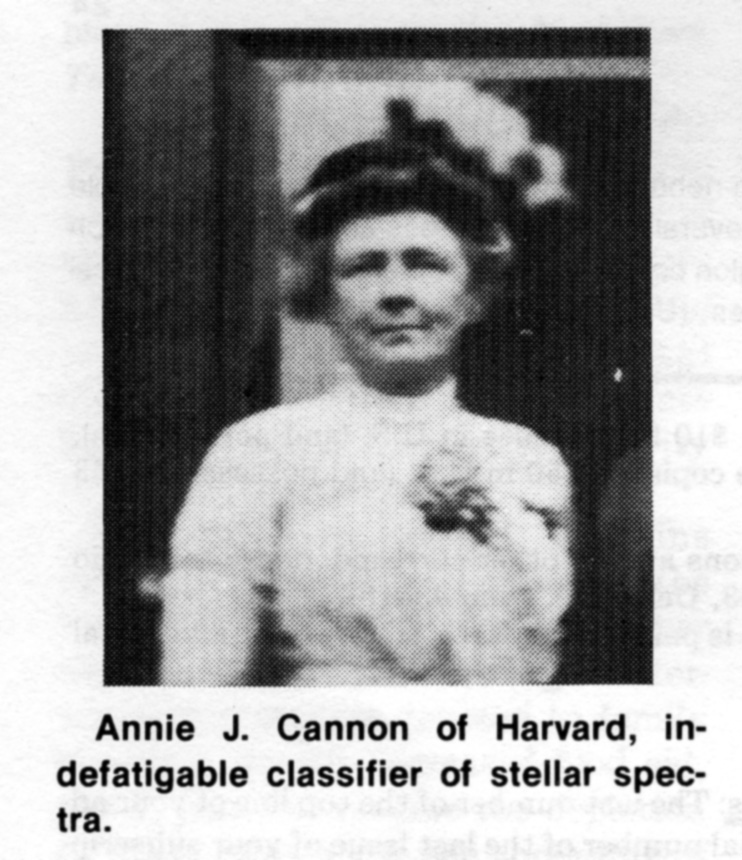
Near the end of the 19th century photographic studies of the spectra of stars were initiated.* (*When the light of a star is passed through a prism it may be spread into a spectrum or rainbow of colors, each color representing a different wavelength. From such stellar spectra stars can be classified. — Ed.) Soon hundreds of thousands of stellar spectra were collected. A classification scheme based on the appearance of stellar spectra in the blue-violet to green region, (the region for which the ordinary photographic emulsion is most sensitive), was undertaken by Annie J. Cannon and her collaborators at Harvard College Observatory.
Initially, the letter A was assigned to those stars whose spectra appeared the simplest, and successive letters of alphabet were used for more and more complex spectra. As the scheme evolved, some of the types were merged and certain letters were dropped. At the same time, it was realized that the changing features of spectra of stars were almost exclusively due to the temperature in the outer layers of the stars. That is, the spectral classification actually arranges stars in order of their surface temperatures. There is a correlation between the star's surface temperature and its characteristic color; the cool stars appear reddish while the very hot stars appear bluish. By the time Annie Cannon's work was completed and published as the Henry Draper (HD) Catalogue in 1924, nearly 99 percent of over 220,000 stars in this catalogue could be classified into seven principal classes or types. These are, in order of decreasing temperatures: O, B, A, F, G, K, and M. There is a continuous gradation from one type to the next so that each type is subdivided into ten subclasses denoted by numbers 0 through 9. Thus, a star whose spectrum appears to fall half-way between the types B0 and A0 would be classified as B5. In recent years, some improvement and modifications were introduced, but the essential feature of the Harvard Classification scheme is still in use today.
Principal features and temperature range of each spectral type are as follows:
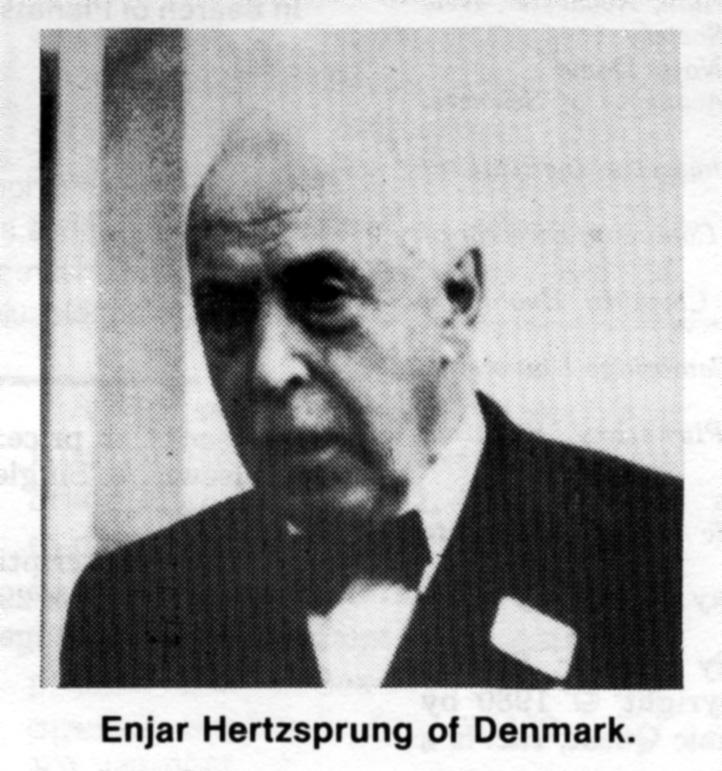
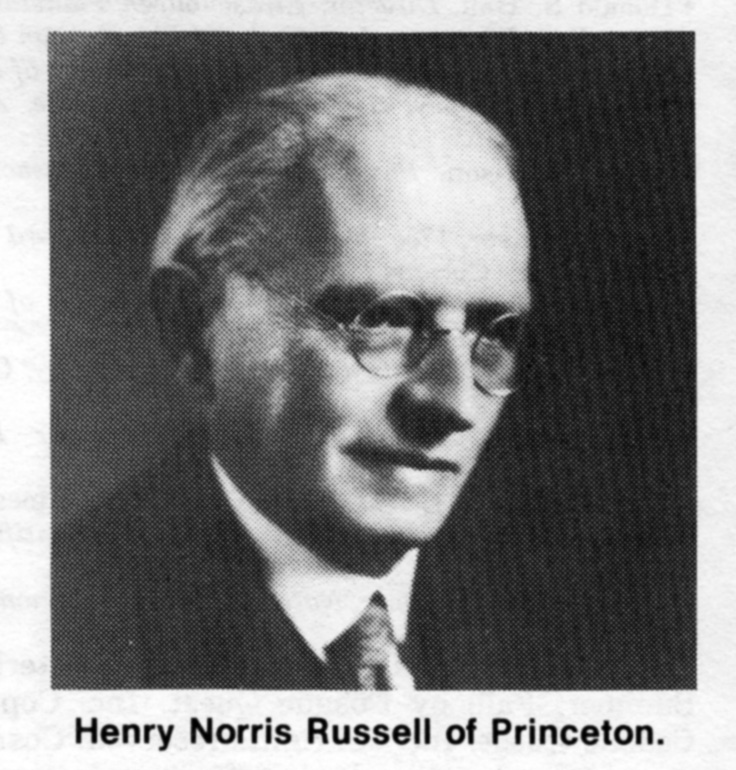
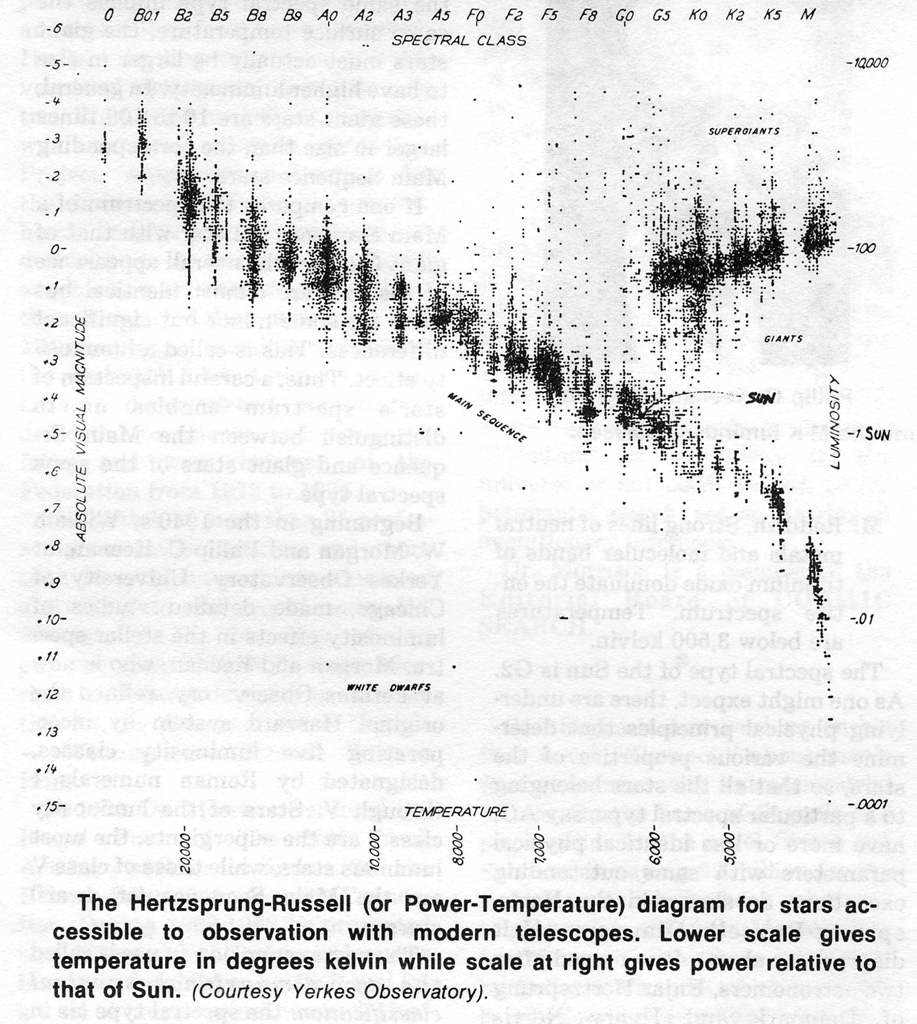
The spectral type of the Sun is G2. As one might expect, there are underlying physical principles that determine the various properties of the stars, so that all the stars belonging to a particular spectral type, say A0, have more or less identical physical parameters with some outstanding exceptions as shown in the Hertzsprung-Russell Diagram (H-R diagram for short). It is named after two astronomers, Enjar Hertzsprung of Denmark and Henry Norris Russell of Princeton University, who
first made such diagrams around 1914 independently of each other.
Originators of the power-temperature (or H-R) diagram for stars.
The total luminosity of a star, that is the total power radiated by the star as a whole, is plotted against its spectrum type. A great majority of the stars fall into a diagonal region on this diagram called the Main Sequence. Along the Main Sequence, going from the blue O stars toward red M stars, we find that both the luminosity and surface temperature decline together. It is also found that the total mass decreases in the same direction. Thus blue O stars are the most massive, most luminous and hottest, while red M stars the least massive, least luminous and coolest. A yellow G star, including our Sun, can be considered as an average star.
Some stars are found to lie above and to the right of the Main Sequence. For these stars, the spectral type is the same but they are intrinsically more luminous than the corresponding Main Sequence stars. These stars are called giants. Since the same spectral type implies the same surface temperature, the giant stars must actually be larger in size to have higher luminosity. In general, these giant stars are 10 to 100 times larger in size than the corresponding Main Sequence stars.
If one compares the spectrum of a Main Sequence G2 star with that of giant G2 star, the overall appearance of the two are almost identical but there are some minor but significant differences. This is called a luminosity effect. Thus, a careful inspection of star's spectrum enables us to distinguish between the Main Sequence and giant stars of the same spectral type.
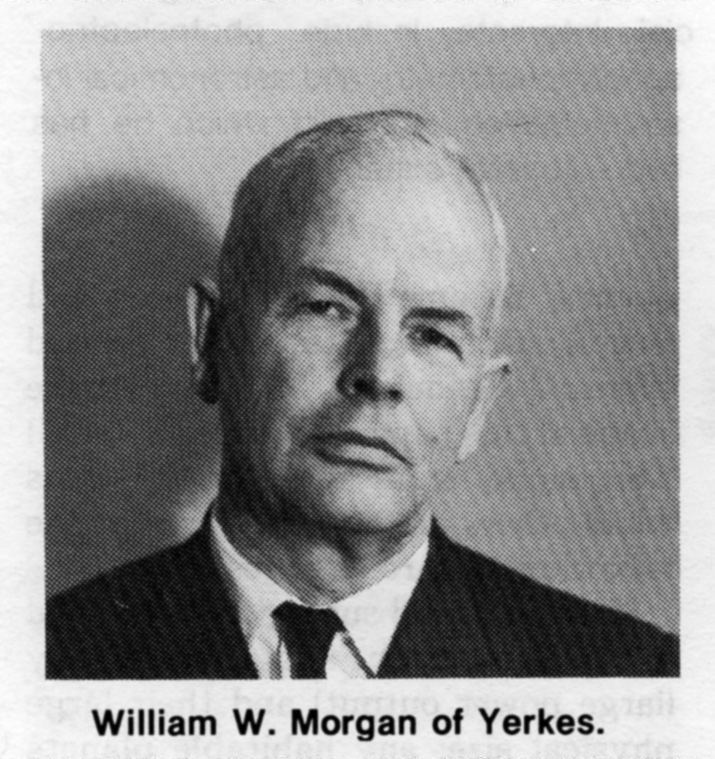
Beginning in the 1940's, William W. Morgan and Philip C. Keenan, at Yerkes Observatory, University of Chicago, made detailed studies of luminosity effects in the stellar spectra. Morgan and Keenan, who is now at Perkins Observatory, refined the original Harvard system by incorporating five luminosity classes, designated by Roman numerals I through V. Stars of the luminosity class I are the supergiants, the most luminous stars, while those of class V are the Main Sequence (or dwarf)
stars.
Refiners of spectral designations into the M-K luminosity classes.
The new system now in use is called the two-dimensional spectral classification: the spectral type (as in the original Harvard system) followed by Morgan and Keenan's (M-K) luminosity class. In this scheme, the Sun is classified as G2 V (yellow dwarf), while the star Rigel in the constellation Orion is B8 Ia (Blue supergiant) (the class I is further subdivided into a and b with Ia being the more luminous of the most luminous supergiants).
According to the current understanding of stellar evolution, the Main Sequence is where the stars spend most of their life. Giants and supergiants are evolved stars which, having spent their allotted time on the Main Sequence, become more luminous and larger, and are on their way toward eventual extinction. It is beyond the scope of this paper to discuss in detail why some stars are "good" suns while others are not. But briefly, the following picture emerges.
The giants and supergiants are ruled out because of their high luminosity (large power output) and their large physical size; any habitable planets that might have surrounded them initially would have been destroyed. Along the Main Sequence, O to about F5 stars (blue and white stars) are excluded for a couple of reasons. First, they all seem to rotate very fast, indicating that these stars are not likely to harbor any planets. Second, and perhaps more serious is the fact that their Main Sequence life time is much too short, less than 1 billion years, before they evolve into giants or supergiants.
At the other end of the classification, most of the M red dwarf stars exhibit rather violent flare activities, pouring out radiation and charged particles that may destroy the favorable environment for life on planets around these stars. Thus, we are left with G, K, (yellow and orange) and possibly some Main Sequence F stars as the prime candidates for good stars. It is not surprising that our Sun is in the group.
Our task is now clear. We must sift through some 10 million stars within 1000 light-years from the Sun and pick out G and K (yellow and orange) Main Sequence stars by identifying their spectral features. This must be done rapidly, economically and accurately. It is hoped that such an efficient large-scale spectral classification method becomes available very soon.
Born in Korea in 1927 he holds a B.S. degree from St. Norbert College (DePere, Wisconsin) and M.S. and Ph.D. degrees from the University of Wisconsin (Madison). Dr. Bahng's special interests include photoelectric spectrophotometry and astronomical instrumentation, areas in which he has had extensive experience.
|