![[NAAPO Logo]](../../Images/NAAPOsm.jpg) North American AstroPhysical Observatory (NAAPO)
|
|
ABCs of Space
By: John Kraus
A. The Earth's Rings.
The rings of Saturn are its best known feature. For years the rings were thought to be unique. But now we know that both Uranus and Jupiter have rings.
The earth also has rings, at least four of them: two Van Allen rings, a Clarke ring and, extending farthest out, an auroral ring.
The earth's magnetism or magnetic field tends to trap many of the rapidly-moving charged particles (mostly electrons and protons) that flow out from the sun with the solar wind. These trapped particles form two doughnut-shaped belts or rings around the earth which were discovered by James Van Allen of the University of Iowa using particle counters carried into orbit early in 1958 on Explorer I, the first U.S. satellite. Although the rings are not visible, their presence is manifest in other ways: probes passing through them readily detect their charged particles.
The inner Van Allen ring is about 2500 kilometers and the outer Van Allen ring about 15000 kilometers above the earth's equator. Regions over the earth's poles are relatively free from these trapped particles. Since the particles are traveling rapidly, they can be damaging to space vehicles and dangerous to astronauts.
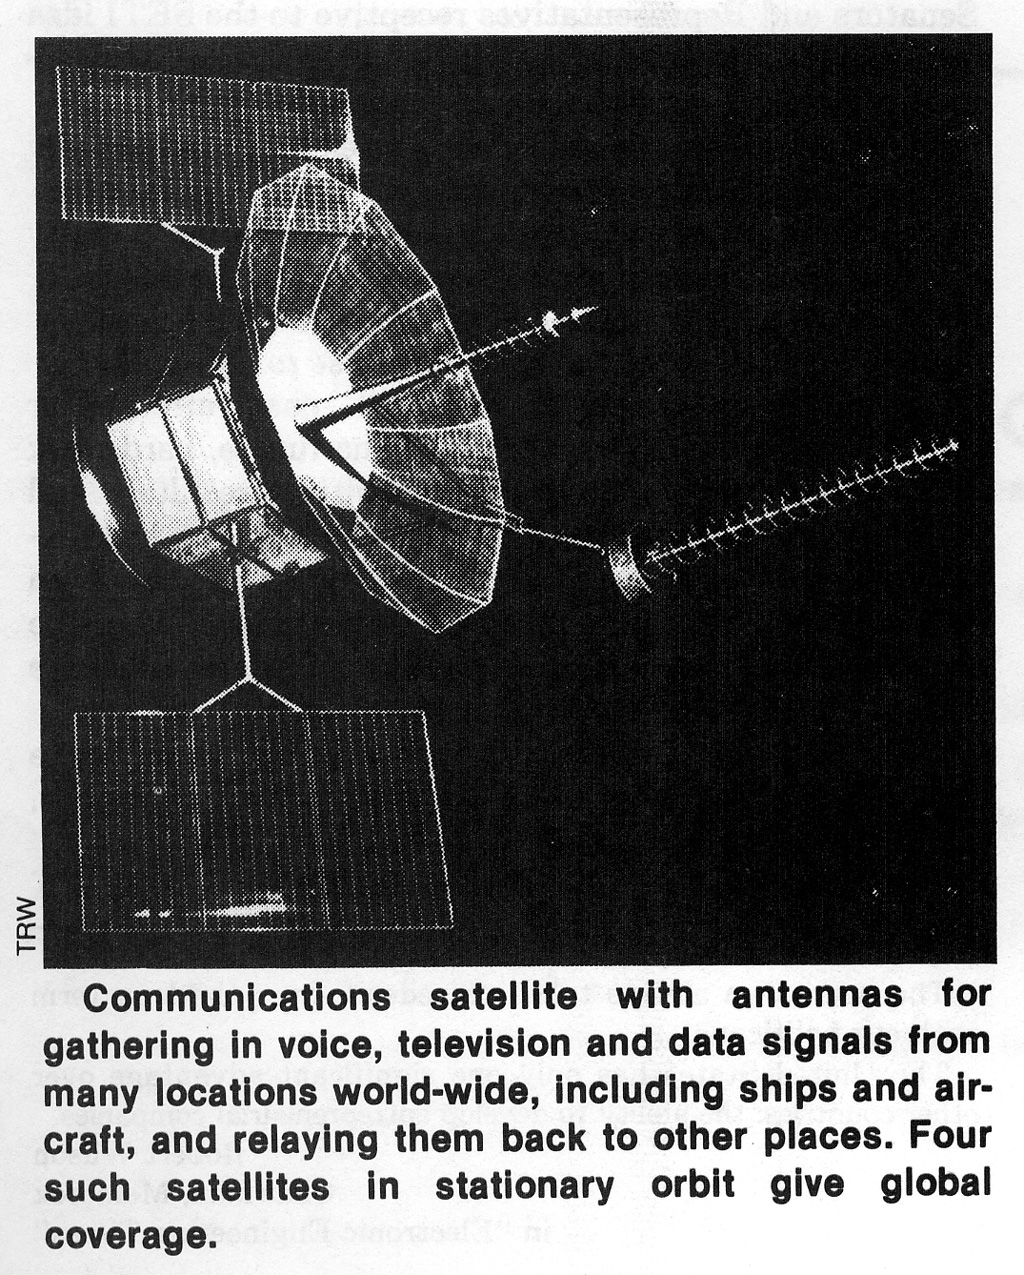
In 1945, while a radar officer in the Royal Air Force, Arthur C. Clarke published an article in Wireless World in which he proposed the use of artificial satellites and, in particular, those in a geostationary orbit, as a solution to the world communication problem. This was in the pre-Sputnik era and such a proposal then seemed highly visionary. Yet 12 years later Sputnik went up and only 6 years after that, or in 1963, the first successful geostationary satellite, Syncom 2, was put into orbit, and Clarke's proposal became a reality. Now there are many such satellites forming a Clarke ring around the earth at a height of 36000 kilometers above the equator with more satellites being added at frequent intervals.
Farthest out, at heights of as much as 65000 kilometers above the equator, is a great auroral ring or zone enveloping the earth like a huge dune-buggy tire. As with the Van Allen rings, this ring consists of particles trapped in the earth's magnetic field. At the inner cusps of this ring, near the polar regions of the earth, the particles from this ring sometimes enter the earth's upper atmosphere producing the often-spectacular auroral displays.
Presently, there are 65 communication satellites in the Clarke ring. These satellites move with the earth as though attached to it so that from the earth each appears to remain stationary above a fixed point on the equator, hence the name earth- or geo-stationary satellite.
The U.S. owns two dozen of the satellites, Russia and Japan have about a dozen each and the rest of the world the remainder. On a daily basis these communication satellites handle millions of conversations and large amounts of data between points all around the world. However, not all of the communication is of an international type, many satellites being used for communication between two points in the same country. The U.S., Russia and Canada use satellites extensively for such internal communications.
In addition to the 65 communication satellites there are 15 more in the Clarke ring which are used for meteorological, scientific and experimental purposes. Two years after Syncom-2 was launched, a second communication satellite, Early Bird, was put up and live trans-Atlantic television transmission became possible. Gradually more satellites appeared in geostationary orbit but at a very slow rate until a few years ago when interest increased and many more began to go up. Now the demand for parking space in the Clarke ring and for radio channels for communication have increased dramatically and it is expected that in the next decade or so the number of satellites will increase many fold and also that many additional services will be offered.
Direct home-TV from Clarke satellites could become commonplace. The Communication Satellite Corporation, Comsat, has proposed 2 to 6 channels for U.S. TV viewers on a subscription basis in competition with the established TV networks and cable TV. However, Comsat's plans recently received a setback when Sears, Roebuck and Co. announced that it was terminating its negotiations with Comsat to develop the first U.S. direct satellite-to-home TV service. Sears indicated it was interested in such a service but only to the extent of installing and servicing the home units and not in becoming an investing partner with Comsat in the overall satellite venture.
In addition to the U.S. Comsat, there is an International Telecommunications Satellite Organization, or Intelsat, which has over 100 participating nations using geostationary satellites. While overall costs may be going up, the cost for a single one-way channel has decreased from $32000 15 years ago to $5000 today.
Personal communication with portable units between any two persons anywhere on earth may also become commonplace. Without using existing communication systems, a world traveler could talk via satellite directly with his home or office in Wichita, Kansas, with equal ease from the sidewalks of Unter den Linden, in Berlin, from an isolated oasis in the Sahara desert, from the desolate outback of Australia, or from the airport at Wichita, and, if the aircraft he rides in is suitably equipped, he can also do it while in flight over the Atlantic and Pacific Oceans.* (*Inside an aircraft the portable unit would be cut off by the shielding effect of the metal fuselage. However, a cable from the passenger seat to an external antenna could permit satisfactory communication.) If every one of the earth's 5 billion inhabitants were to carry such a unit, the traffic in communications and the need for satellites could become astronomic.
Eventually the Clarke ring could fill up with satellites until it might be desirable to link all of the satellites mechanically into a continuous rigid ring. But such density would require antennas with narrower beams for both the satellite and the earth stations. Presently satellites using the same frequency need to stay several degrees apart (or a couple thousand kilometers) in order that ground stations can separate them.
Also a great increase in the number of available channels will be required. Currently most communication satellites operate at wavelengths of 5 to 7 centimeters but some use shorter wavelengths of 2 to 3 centimeters. Even shorter wavelengths will, no doubt, see extensive use in the future because these shorter wavelengths or higher frequencies can accommodate more channels, however, attenuation by rain and absorbtion by water vapor may be a problem.
The Clarke ring is mankind's first astro-engineering structure on a grand scale. Although the earth did not come equipped with such a ring, we are constructing one. AND, it is being built as a commercial, money-making enterprise to provide mankind with an economical, reliable, world-wide communications system. The Clarke ring, 36000 kilometers above the equator, already provides services, employment and profits for millions of earthlings. With the Clarke ring, space has become a commercial enterprise.
Arthur C. Clarke, who now resides in Sri Lanka, is a member of the Editorial Board of COSMIC SEARCH.
Summary:
B. Toward a Full-Spectrum Astronomy and a New All-Encompassing View of the Cosmos.
Ancient shepherds, astronomers and other watchers of the sky viewed the heavens with unaided eye. This marvelous organ is responsive to a narrow band of wavelengths, or visible spectrum, embracing the entire rainbow of colors from violet, through blue, green, yellow and orange to red or from 400 to 700 nanometers wavelength. This is the nominal range of sensitivity of the human eye. Wavelengths less than 400 nanometers are called ultra-violet and wavelengths longer than 700 nanometers are called infra-red. Bees' eyes are sensitive to ultra-violet wavelengths almost as short as 300 nanometers and some snakes have receptors or pits sensitive to infra-red or heat wavelengths. A nanometer is one-millionth of a millimeter.
X-rays are shorter than ultra-violet and gamma rays shorter still. At the other end of the spectrum beyond the infra-red, wavelengths longer than about 1 millimeter are called radio waves.
Galileo's invention of the telescope made it possible to see fainter objects and greater detail but it did not extend the wavelength range beyond that of the human eye. However, with the advent of photography and other more recent techniques, astronomers extended their range of detection down to 300 nanometers in the ultra-violet and up to about 1000 nanometers in the infra-red.
But beyond that they could not go because the atmosphere is opaque to wavelengths shorter than 300 nanometers and longer than about 1000 nanometers. This range of atmospheric transparency is called the optical window* and celestial observations from the earth's surface are restricted to this part of the electromagnetic spectrum except for a few narrow windows in the 1 to 35 micrometer region and for a radio window. (*The limits of 300 and 1000 nanometers are somewhat arbitrary and have been rounded off for convenience; actually the long wavelength limit is more like 1100 nanometers. The nominal 400 and 700 nanometer values for the visual spectrum are also somewhat arbitrary; some authorities would place the long wavelength limit at 750 nanometers. In any case, the cut-off at the limits is not knife-edge sharp but rather gradual.)
It is significant that the wavelength range of human vision lies in the middle of the optical window, probably as a result of an evolutionary development of the eye to become most sensitive at those wavelengths for which the sun is brightest and the window most transparent.
About 1930 Karl Jansky discovered radio waves from our galaxy, opening a second "window" into space. This led, in the succeeding decades, to the development of radio astronomy with radiation from celestial objects being detected at the much longer wavelengths from 1 millimeter to some tens of meters. This wide range of wavelengths is called the radio window through which electromagnetic waves from space can reach the earth's surface. The window is cut off at the short wavelength end (about 1 millimeter) by the opacity of the atmosphere while the long wavelength end is cut off, not by the atmosphere, but by an ionized layer or blanket of charged particles called the ionosphere which envelops the earth at a height of several hundred kilometers.* (*The long wavelength limit due to the ionosphere is variable and is at longer wavelengths on the night side of the earth because it is shielded from the sun which is responsible for much of the ionization.)
Radio astronomy has had a revolutionary effect on our knowledge of the universe but it has been only a precursor of the further revolution in astronomy that has occurred in the years after Sputnik, in which telescopes for many wavelengths have been lofted into space above the earth's atmosphere and ionosphere. The view of these space telescopes is not limited to the optical and radio windows but is open to all wavelengths. (See "The Electromagnetic Spectrum" in ABCs for Spring 1980.)
Orbiting ultra-violet, x-ray and gamma ray telescopes have extended our knowledge of the universe to the shortest electromagnetic waves while infra-red telescopes and very long wavelength telescopes in space have stretched the cosmic spectrum to radio wavelengths of 1000s of meters.
Actually the earth radiates a strong noise from its Van Allen belts at wavelengths of 1000 to 3000 meters (see ABCs in the Winter 1980 COSMIC SEARCH) so being in earth orbit and above the ionosphere is not enough. Accordingly, the NASA Radio Astronomy Explorer-2 for wavelengths of 30 to 1200 meters was put into orbit around the moon so that during a part of each revolution it would be shielded by the moon from both the sun and the earth.
We have now entered an era of full-spectrum or all-wavelength astronomy in which observations of celestial objects can be made over the entire range of the electromagnetic spectrum. However, data on most celestial objects is still fragmentary and many more observations at more wavelengths will be required to provide complete spectra.
As an example, consider the quasar OQ172, the most distant known object in the universe. What we know about its spectrum is shown in the All-Wavelength Spectrum where the heavy line portions indicate the wavelengths for which actual measurements have been made. These are in the radio, optical, and x-ray regions. The lighter line portions are assumed extrapolations through the infra-red and ultra-violet regions where measurements have yet to be made.
Two spectral curves are shown, one based on observations, and, to its left, the spectrum as it would be if OQ172 were not moving with respect to us instead of receding from us at 91 percent of the velocity of light. The most prominent feature is the Lyman-alpha line of hydrogen which is Doppler or redshifted from the ultra-violet into the middle of the visible spectrum.
As discussed in the next section of ABCs, much has been learned about the nature of OQ172 but much more remains to be learned. Will infra-red and ultra-violet measurements confirm the extrapolations assumed in the diagram or will there be some surprises? As our all-wavelength astronomy matures and observations are made at more and more wavelengths we can hope to find out.
Summary:
C. How Is a Quasar's Redshift Determined and Its Distance Inferred? In the preceding section we called OQ172 the most distant known object in the universe. How was this determined? The account reads like a detective story: In 1967 during the Ohio State University 21-centimeter sky survey a strong radio source was discovered which was designated OQ172. The fact that it had not previously been detected in the longer wavelength surveys of other radio observatories suggested that OQ172 had an unusual spectrum. Additional measurements were then made at a Canadian radio observatory. Next, a French astronomer found that the position of OQ172 in the sky coincided with a faint star-like object. This identification of a "star" (actually a quasar) with OQ172 was then confirmed when a very precise position for OQ172, as measured at an English radio observatory, was found to agree very closely with the "star's" location. With this information in hand, a team of astronomers at the Lick Observatory, California, used a newly developed electronic scanner to obtain an optical spectrum of OQ172 which established its redshift at a recordbreaking 3.53 or 353 percent. Later a wider spectrum was measured with the Palomar 5-meter telescope. Subsequently, a team of 23 radio astronomers in six countries measured a detailed radio spectrum and recently a group at Columbia University, New York, detected OQ172 at x-ray wavelengths using the orbiting Einstein Observatory (High Energy Astronomical Observatory-2) of the National Aeronautics and Space Administration. Now let's examine how the high redshift for OQ172 was determined and what this means. The Lick Observatory team found peaks of intensity in the optical spectrum which they related to emission from atoms of the elements of hydrogen and carbon in OQ172 but shifted to much longer wavelengths than these same atoms emit in a laboratory here on the earth. The shift is interpreted to mean that OQ172 is rapidly receding from us, the increase in wavelength being due to the Doppler effect. More explicitly the Lick Observatory team found a very prominent peak at 554 nanometers and a weaker one at 702 nanometers. These wavelengths have the same ratio that certain hydrogen and carbon lines have in the laboratory where their wavelengths are 122 and 155 nanometers, respectively.* (*The redshift is equal to the difference of the shifted and unshifted wavelengths divided by the unshifted wavelength. Thus, we have (702 - 155)/155 = 3.53 or 353 percent.) Thus, the Lick team could conclude that the emission peaks were due to atoms of excited but un-ionized hydrogen (Lyman-alpha line) and triply-ionized carbon (three electrons missing) but both lines Doppler shifted to longer wavelengths because OQ172 was receding from us at the unprecedented velocity of 91 percent of the speed of light and was at a distance of nearly 14 billion light-years in a universe of 15 billion light-years radius. See accompanying Spectral-Line Redshift Diagram for Quasars. (For an explanation of the Doppler effect see ABCs Fall 1979, and for a discussion of the size of the universe see ABCs for Spring 1980.)
 The 353 percent redshift for OQ172 is an experimental result which stands on its own. If the spectral peaks are actually due to atoms of hydrogen and carbon, as seems well established, the redshift value is not subject to interpretations or assumptions. However, the velocity and distance values are inferred results which depend on the assumption that OQ172 is receding from us in a universe which is expanding uniformly (with a certain Hubble constant* (*See ABCs for the last issue (Spring 1980)) following an initial Big Bang. The redshift might be interpreted in other ways, but the interpretation we have made is generally thought to be the most plausible. Although the above discussion indicates the general procedure, it is greatly oversimplified and much more enters into the various steps. For example, the hydrogen and carbon lines of OQ172 are also found in other quasars of lesser redshift and this lends confidence that the analysis is correct. The principal atomic emission lines used for determining the redshifts of quasars are shown in the diagram. All of the quasars listed were discovered with radio telescopes, then identified with an optical object (quasar) and finally an optical spectrum obtained with emission lines which could be identified unambiguously with atomic elements. The radio surveys acts as an arrow directing the attention to what might otherwise be regarded as very faint, ordinary stars. As the redshift increases, the observed wavelength of the emission lines becomes longer so that lines normally in the visible (at zero redshift in an earth laboratory) move into the infra-red, while lines in the ultra-violet (notably the Lyman-alpha line) shift into the visible. The solid dots on the lines indicate that these particular lines were used in the redshift determination of a particular quasar. The half-circles (at zero redshift) indicate the wavelength of the lines for a stationary source, as in a laboratory on the earth. For smaller redshifts (under 50 percent) the lines of magnesium, neon and hydrogen (Balmer beta and gamma lines) were the keys to the redshift,* (*Recently, with an orbiting ultra-violet telescope, the Lyman-alpha line was found to be prominent in the spectrum of the low redshift quasar 3C273.) while at higher redshifts of 200 percent or more, a carbon line and the Lyman-alpha line of hydrogen were the keys. Note how the two dots on these lines for the quasar OI-061 at about 200 percent redshift move to the right or to longer wavelengths as the redshift increases, culminating in the values for the highest redshift quasars OQ172 and OH471. It is apparent that for a hypothetical quasar with a redshift of 500 percent these lines will be shifted entirely out of the visible spectrum. When Professor Theodore Lyman first succeeded in observing the 122 nanometer line of hydrogen (now known as the Lyman-alpha line) in a Harvard physics laboratory in 1905, he could not have forseen that 7 decades later this line would be found in the spectrum of faint quasars but shifted from the ultra-violet into the visible and play a key role in determining their large redshift and enormous distance. What can be said about the nature of the quasars, such as OQ172? Although a quasar is quasi-stellar in appearance, or looks like a star, it is not a star. A quasar is believed to be a galaxy or aggregation of many stars with a very dense, powerful nucleus which, because of its great distance from us, appears as a single star-like point of light. For OQ172, the Lick Observatory team measured not only a 353 percent redshift for hydrogen and carbon emission lines but somewhat lesser redshifts for hundreds of absorption lines involving additional elements, suggesting that the emitting nucleus of OQ172 is surrounded by expanding clouds of gas thrown off, perhaps, by a succession of great explosions. From all these lines there is evidence that atoms of hydrogen, carbon, silicon, sulphur and nitrogen are present in OQ172. Summary:
THE OQ172 Story:
A cooperative effort by many astronomers List of original references 1. Discovery with the 110-meter Ohio State University radio telescope by Lewis Fitch, Robert Dixon and John Kraus, Astronomical Journal, June, 1969. 2. More data from combined observations with the Ohio State University and Algonquin Park, Canada, radio telescopes. Two articles: one by Bryan Andrew and John Kraus and another by John Kraus and Bryan Andrew, both in Astrophysical Journal Letters, Jan. 1970. 3. Optical identification at the Paris Observatory by M.P. Veron, Astronomy and Astrophysics, vol. 11, page 1, 1971. 4. Very precise radio position determined at the Royal Radar Establishment, Malvern, England, by H. Gent, J.H. Crowther, R.L. Adgie, D.G. Hazard and J.L. Jauncey, Nature, vol. 241, page 261, 1973. 5. Redshift determination with the 3-meter optical telescope at the Lick Observatory (California) by Joseph Wampler, Lloyd Robinson, Jack Baldwin and Margaret Burbridge, Nature, June 8, 1973. 6. Optical spectrum with the Mount Palomar 5-meter telescope by J.B. Oke, Astrophysical Journal, April 15, 1974. 7. Complete radio spectrum measured by Mirjana Gearhart and John Kraus, Ohio State University; Bryan Andrew, National Research Council, Canada; Glen Blake, Paul Scott and Martin Ryle, Cambridge University, England; S. Ya. Braude, N.K. Sharykin and I.N. Zhouck, Institute of Radio Physics, USSR; Alan Bridle, Queen's University, Canada; E.K. Conklin, National Radio Astronomy Observatory, Kitt Peak, Arizona; James Douglas, University of Texas; O. Hachenberg and M. Thiel, Max Planck Institut fur Radioastronomie, Bonn, West Germany; Pierre Kaufmann, Universidade Mackenzie, Brazil; C.R. Purton, P.A. Feldman and K.A. Marsh, York University, Canada; Mark Stull and Kent Price, Stanford University; John Warner and G. Assousa, Carnegie Institution of Washington; and B. Balick, Lick Observatory, California; Nature, June 21, 1974. Many radio telescopes throughout the world were used for these measurements. 8. X-ray spectrum with the orbiting Einstein Observatory (High Energy Astronomical Observatory-2) by William H-M Ku, Robert Novick, Knox Long and David Helfand of Columbia University. Private communication from William Ku to John Kraus, Feb. 1980.

|