![[NAAPO Logo]](../../Images/NAAPOsm.jpg) North American AstroPhysical Observatory (NAAPO)
|
|
ABCs of Space
By: John Kraus A. The Doppler Effect (Wavelengths are relative. The Red Shift)
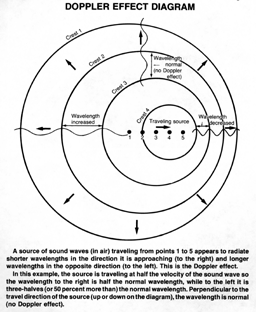
When a rapidly moving vehicle passes with its horn sounding, there is an abrupt decrease in the pitch of the horn. This is the Doppler effect, first described by Christian Johann Doppler of Vienna in 1842.
A decrease in pitch (or frequency) corresponds to an increase in wavelength. Thus, a receding object has a longer wavelength (or lower frequency) than when it is approaching. The effect can be observed for sound waves, water waves and electromagnetic waves (light and radio waves).
As explained in ABCs for the Summer 1979 issue, chemical elements have characteristic spectral lines at specific optical wavelengths so that an astronomer can tell what elements are present in a star. However, if the star is receding (or approaching) these lines will be shifted to longer (or shorter) wavelengths by the Doppler effect.
If the star is rotating, a line is broadened from its normal condition because some of the light comes from parts of the star which are moving away and some from parts which are approaching. From the amount of the broadening, conclusions may be drawn about the star's rotation.
About 1930, Edwin Hubble of the Mount Wilson Observatory deduced from spectra of distant galaxies that their light was Doppler shifted to longer or redder wavelengths by an amount which increased with the distance of the galaxy. This red shift of the light from the galaxies indicated that they were rushing away from us at velocities which increased with their distance. This led to the idea of an expanding universe and by an extrapolation backwards in time to its origin from an initial explosion or "big bang" from which it has been expanding ever since.
Summary:
B. The Big Bang Background (3 degrees)
As discussed in the previous section on the Doppler effect, the discovery that the universe was expanding led to the idea that in the distant past the entire universe was in a super compact (high density) state and that its expansion began abruptly with an enormous explosion popularly called the "big bang".
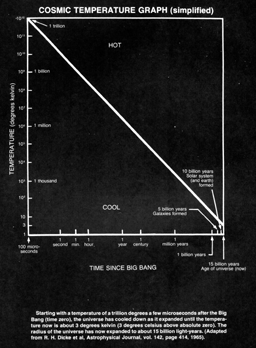
In the 1930s and 40s George Gamow and others outlined a history of the universe: Beginning with the big bang, a fireball of intense radiation blasted outward at the speed of light. Initially this primordial fireball had a temperature of billions of degrees. As it expanded it cooled down. Refinements of Gamow's original idea have led to present theories that put the temperature of the primordial fireball at the time of the explosion (time zero) at a trillion degrees or more. Cooling was rapid at first, decreasing billions of degrees in a matter of seconds. With passage of time, cooling became more gradual. After about 15 billion years (or now), it has reached a value of about 3 degrees celsius above absolute zero as determined by Arno Penzias and Robert Wilson of the Bell Telephone Laboratories in 1965 (see COSMIC SEARCH for March 1979, Vol. 1, No. 2, page 32).
The 3 degree sky background which Penzias and Wilson measured with their radio telescope at a wavelength of 7.4 centimeters establishes a limit to the sensitivity of radio telescopes as discussed in ABCs in the March 1979 issue of COSMIC SEARCH. This 3 degree background temperature covers the entire sky.
We have evolved from cinders of the fireball. As we now look skyward we see the cooled remnant of the primordial fireball in every direction. From this fireball the whole universe, as we know it, has evolved. We are, like a phoenix, creatures born of a fireball.
Summary:
C. All Things both Great and Small: A Chart for Everything in the Universe
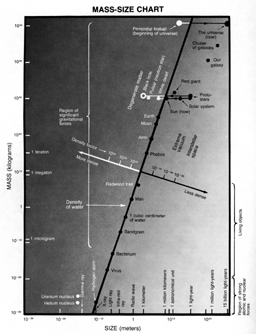
[Caption (in bold) for Mass-Size Chart below]
On the assumption that the object is spherical or cubical, the size dimension is indicative of its volume. The ratio of the mass to the volume of an object is a measure of its density. Thus, a cubic meter of air has a mass of about one kilogram but a cubic meter of lead has a mass 10,000 times as much, so, relatively speaking, air is said to have a low density while lead has a high density. Water is intermediate with a density about 800 times that of air but one eleventh that of lead. From the position of an object on the chart its (average) density can be inferred. Thus, the chart also serves as a Density Diagram for everything in the universe. Objects on the slanting line have the density of water with densities increasing to the left of the line and decreasing to the right. Atomic nuclei and degenerate matter in the form of neutron stars and black holes have the greatest density of anything in the universe while galaxies or the universe itself have the lowest densities, being equivalent on the average to an extreme vacuum.
There is a tendency for large objects to have a lower density and small objects a higher density. The earth and living objects are in between with densities near that of water.
The region of stars and planets, which is of particular interest to SETI, occupies only a small part of the diagram. The figure is constructed with logarithmic scales so that the enormous ranges of mass, size and density are greatly compressed.
Summary:
Distance Table
Distances in light travel time (approx.)
To convert light travel time to kilometers multiply travel time in seconds by velocity of light (300,000 kilometers per second).
|


